Zoom Stock is Up Big on Huge Free Cash Flow - Has ZM Stock Peaked?
/Women%20sitting%20on%20roling%20chair%20in%20front%20of%20computer%20monitors%20by%20ThisisEngineering%20via%20Unsplash.jpg)
Zoom Communications (ZM) produced huge gains in free cash flow (FCF) and FCF margins for the quarter ending July 31. But ZM stock has spiked on the news. Does that mean it has peaked? Maybe, but it could be worth more.
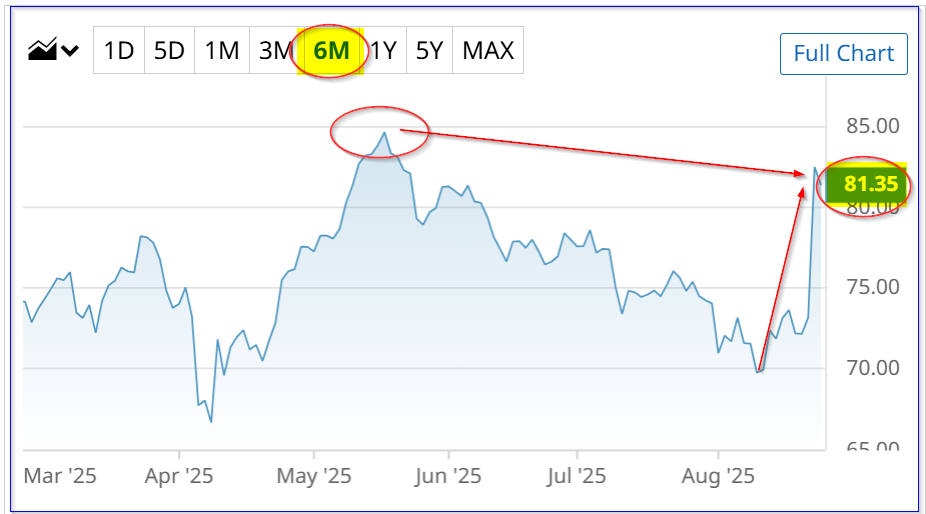
ZM is at $81.35, up +11.2% from $73.15 on Aug. 21, when it released its fiscal Q2 2026 earnings after the market closed. It's also up +17% from a recent trough of $69.55 on Aug. 11. However, ZM stock is still below its 6-month peak of $84.62 on May 16.
Nevertheless, given its strong free cash flow growth and FCF margins, it's possible ZM stock could still be undervalued. This article will delve into this and the best way to play the stock.
Zoom Generates Strong FCF and FCF Margins
Zoom Communications reported on Aug. 21 that revenue rose +4.7% to $1,217 billion over the prior year ending July 31. That was $19 million higher than analysts expected, or +1.6% more than expected.
But that was not why the stock rose so much. It was the free cash flow (FCF), which rose +39.1% from $365.1 million last year to $508 million in fiscal Q2.
That also worked out to a huge FCF margin on sales of 41.7%. That means that over 41% of sales go directly into its checking account with no cash obligations on it.
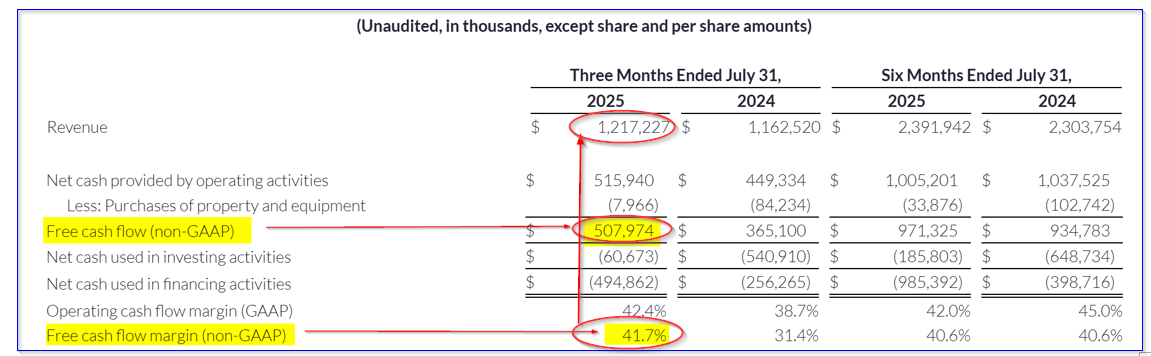
In addition, Zoom is one of the few companies that not only reports its FCF margin (see the table above) but also forecasts its revenue and FCF for the year.
Forecasting FCF and FCF Margins
For example, the company forecasts now that its revenue will be between $4.825 billion and $4.835 billion (i.e., $4.83 billion at the midpoint), and FCF will be between $1.74 billion and $1.78 billion ($1.76 billion midpoint FCF forecast).
That implies a full-year FCF margin of just 36.4% (i.e., $1.76b FCF/$4.83). That seems too low. For example, in the last year, according to Stock Analysis, its FCF margin was higher: 38.82% (i.e., $1.845 billion FCF / $4.754 billion revenue).
We can use this to forecast FCF for the next 12 months (NTM) and then set a price target.
For example, analysts now project revenue for the year ending Jan. 2026 will be $4.83 billion (as implied by management's forecast), but $4.99 billion next year. The average of these two is $4.91 billion for the NTM period.
If we assume that the company will make at least a 38.8% FCF margin, and possibly slightly higher at 39% for the NTM period (given its recent $41.7% FCF margin), FCF will be:
$4.91b x 0.39 = $1.915 billion NTM FCF
We can use that to project its stock market value and a target price.
Target Price for ZM Stock
As of today, ZM stock has a market value of $24.612 billion, according to Yahoo! Finance. That means it has a FCF yield metric of 7.15%, based on management's forecast for FCF:
$1.76b / $24.612 b mkt cap = 0.0715 = 7.15% FCF yield
That means that if the company were to pay out 100% of its FCF to shareholders, the market would give the stock a 7.15% dividend yield.
So, we can apply that to our NTM forecast:
$1.915 b NTM FCF / 0.0715 = $26.78 billion market cap
That works out to a potential rise of +8.8% over today's $24.6 billion market cap. In other words, ZM stock could be worth +8.8% more, or $88.51 per share ($81.35 x 1.088).
Analysts Agree
Moreover, analysts agree. Yahoo! Finance reports that the average price target for 32 analysts is $91.37. Stock Analysis says 25 analysts have an average of $89.26, and AnaChart.com reports that 27 analysts have an average price of $108.69.
The average of the these surveys is $96.44, or +18.5% higher than today's price.
As a result, it's clear, from the company's FCF projections, a next 12-month forecast, and from analysts' target prices, that ZM stock is still likely undervalued.
So, what is the best way to play the stock?
Playing ZM Stock with Options
One play, especially for existing shareholders in ZM stock, is to sell out-of-the-money (OTM) covered calls. That way the investor can set a higher price target and still make income if it doesn't reach that sell point.
For example, the Nov. 21, 2025, expiry period shows that the $87.50 call strike price has a midpoint premium of $2.25.
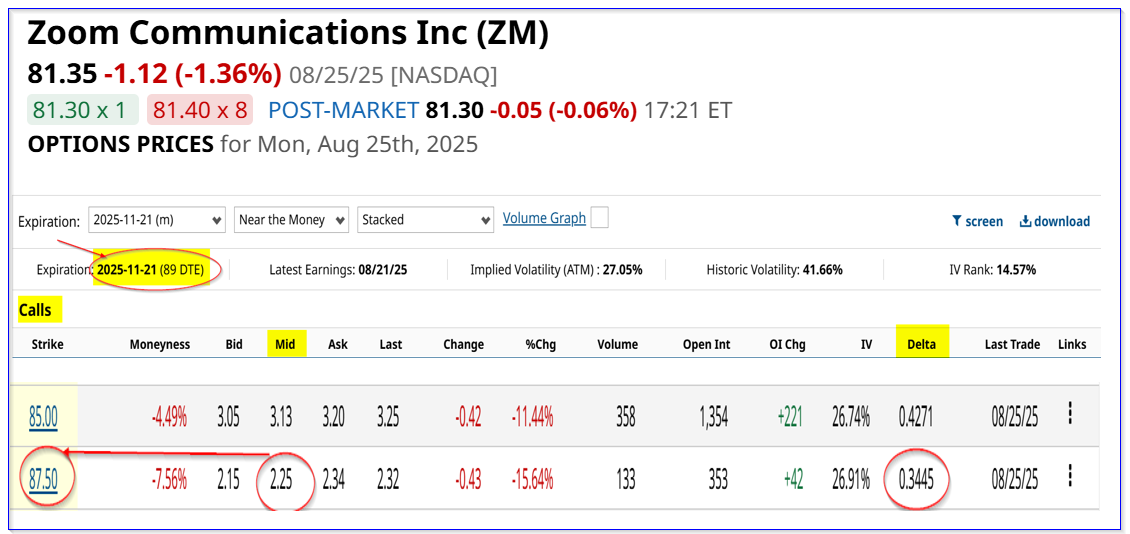
This implies a covered call yield of 2.766% (i.e., $2.25 /$81.35) for the next 3 months. That works out to a monthly average yield of 0.922%, i.e., less than 1%.
However, if the stock rises, the investor benefits from any unrealized gain, plus keeps the income made. And don't forget, the stock has already run up. It may take a dip before moving up towards the target price over the next 12 months.
On the other hand, shorting OTM puts provides a slightly higher average one-month yield potential. For example, the Sept. 26 expiry period shows that the $78.00 put strike price has a midpoint premium of $1.23 for the next month.
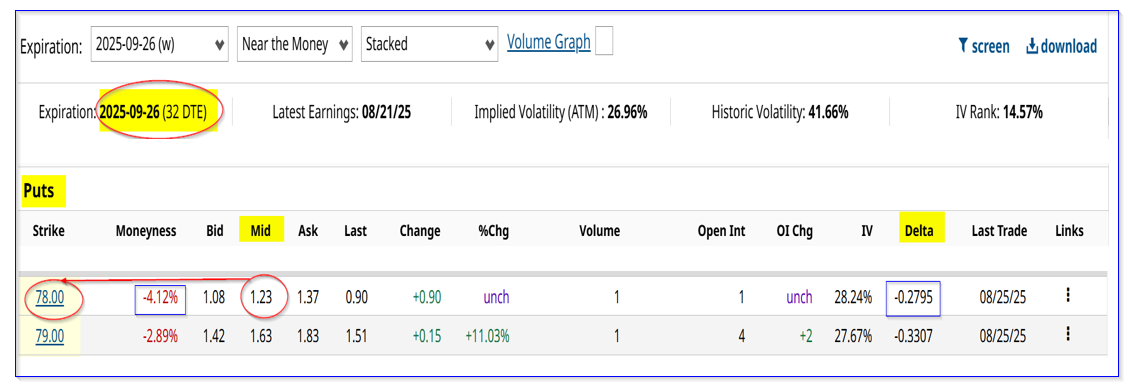
That implies that a short-seller of these puts can make an immediate yield of 1.576% (i.e., $1.23/$78.00). That is much higher than the covered call yield average for 1 month.
However, the investor cannot make any upside if ZM stock rises. So, there is a tradeoff here.
If the investor has enough capital, they might try both of these plays. That way, they can make extra income, plus gain some of the upside in ZM stock.
On the date of publication, Mark R. Hake, CFA did not have (either directly or indirectly) positions in any of the securities mentioned in this article. All information and data in this article is solely for informational purposes. For more information please view the Barchart Disclosure Policy here.